WaveWise
Role
Electrical & Computer Engineer
Tools & Technology
KiCAD, Arduino IDE, Reflow Oven, JLCPCB
Skills
PCBA Design, Arduino Coding, Soldering, Electrical Debugging
Time
August 2023 - December 2023
WaveWise
Electrical & Computer Engineer
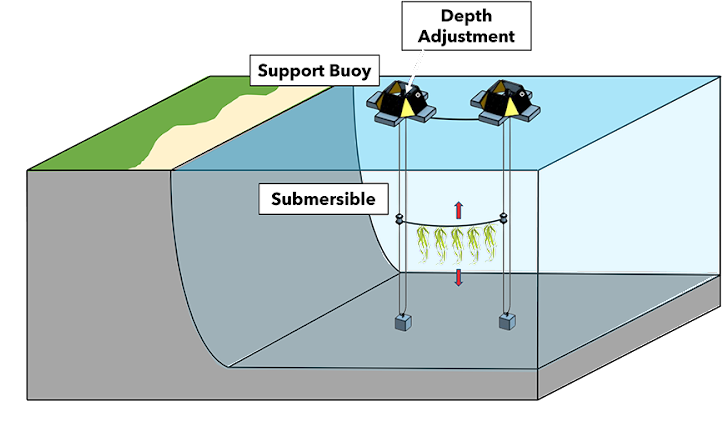
Maine's sugar kelp production faces challenges such as location restrictions
and limited monitoring capabilities. Our client WaveWise approached Generate,
Northeastern's product development club, to create a prototype capable of
dynamic depth adjustment for optimal kelp growth. Our team of 11 talented
individuals delved into researching, ideating, designing, and testing a system
that incorporated a winch system with stepper motor powered depth control.
As an Electrical & Computer Engineer on the team, my primary focus was on
power systems, software architecture, and the design and bringup of the Buoy
PCBA. I collaborated closely with the five other EECEs and our mechanical
engineering counterparts, contributing to the incredible product we were able
to showcase at the end. It was a fulfilling experience working on WaveWise,
navigating the challenges, and contributing to a multifaceted project that
blended innovation with sustainability.
Initial Research
Power Management: Storage, Generation, and Control
When initially tasked with overseeing the power system, I used an existing system—the
crab pot puller—as a baseline for power draw requirements. I operated under this
power assumption while our mechanical engineering team calculated our specific motor
wattage needs. Below are some of the major considerations I took into account when
designing and selecting components for the system:
- Temperature
- Continuous/Peak Discharge
- Capacity
- Weight
- Lifetime Expectancy (cycle count, ratings)
- Environment
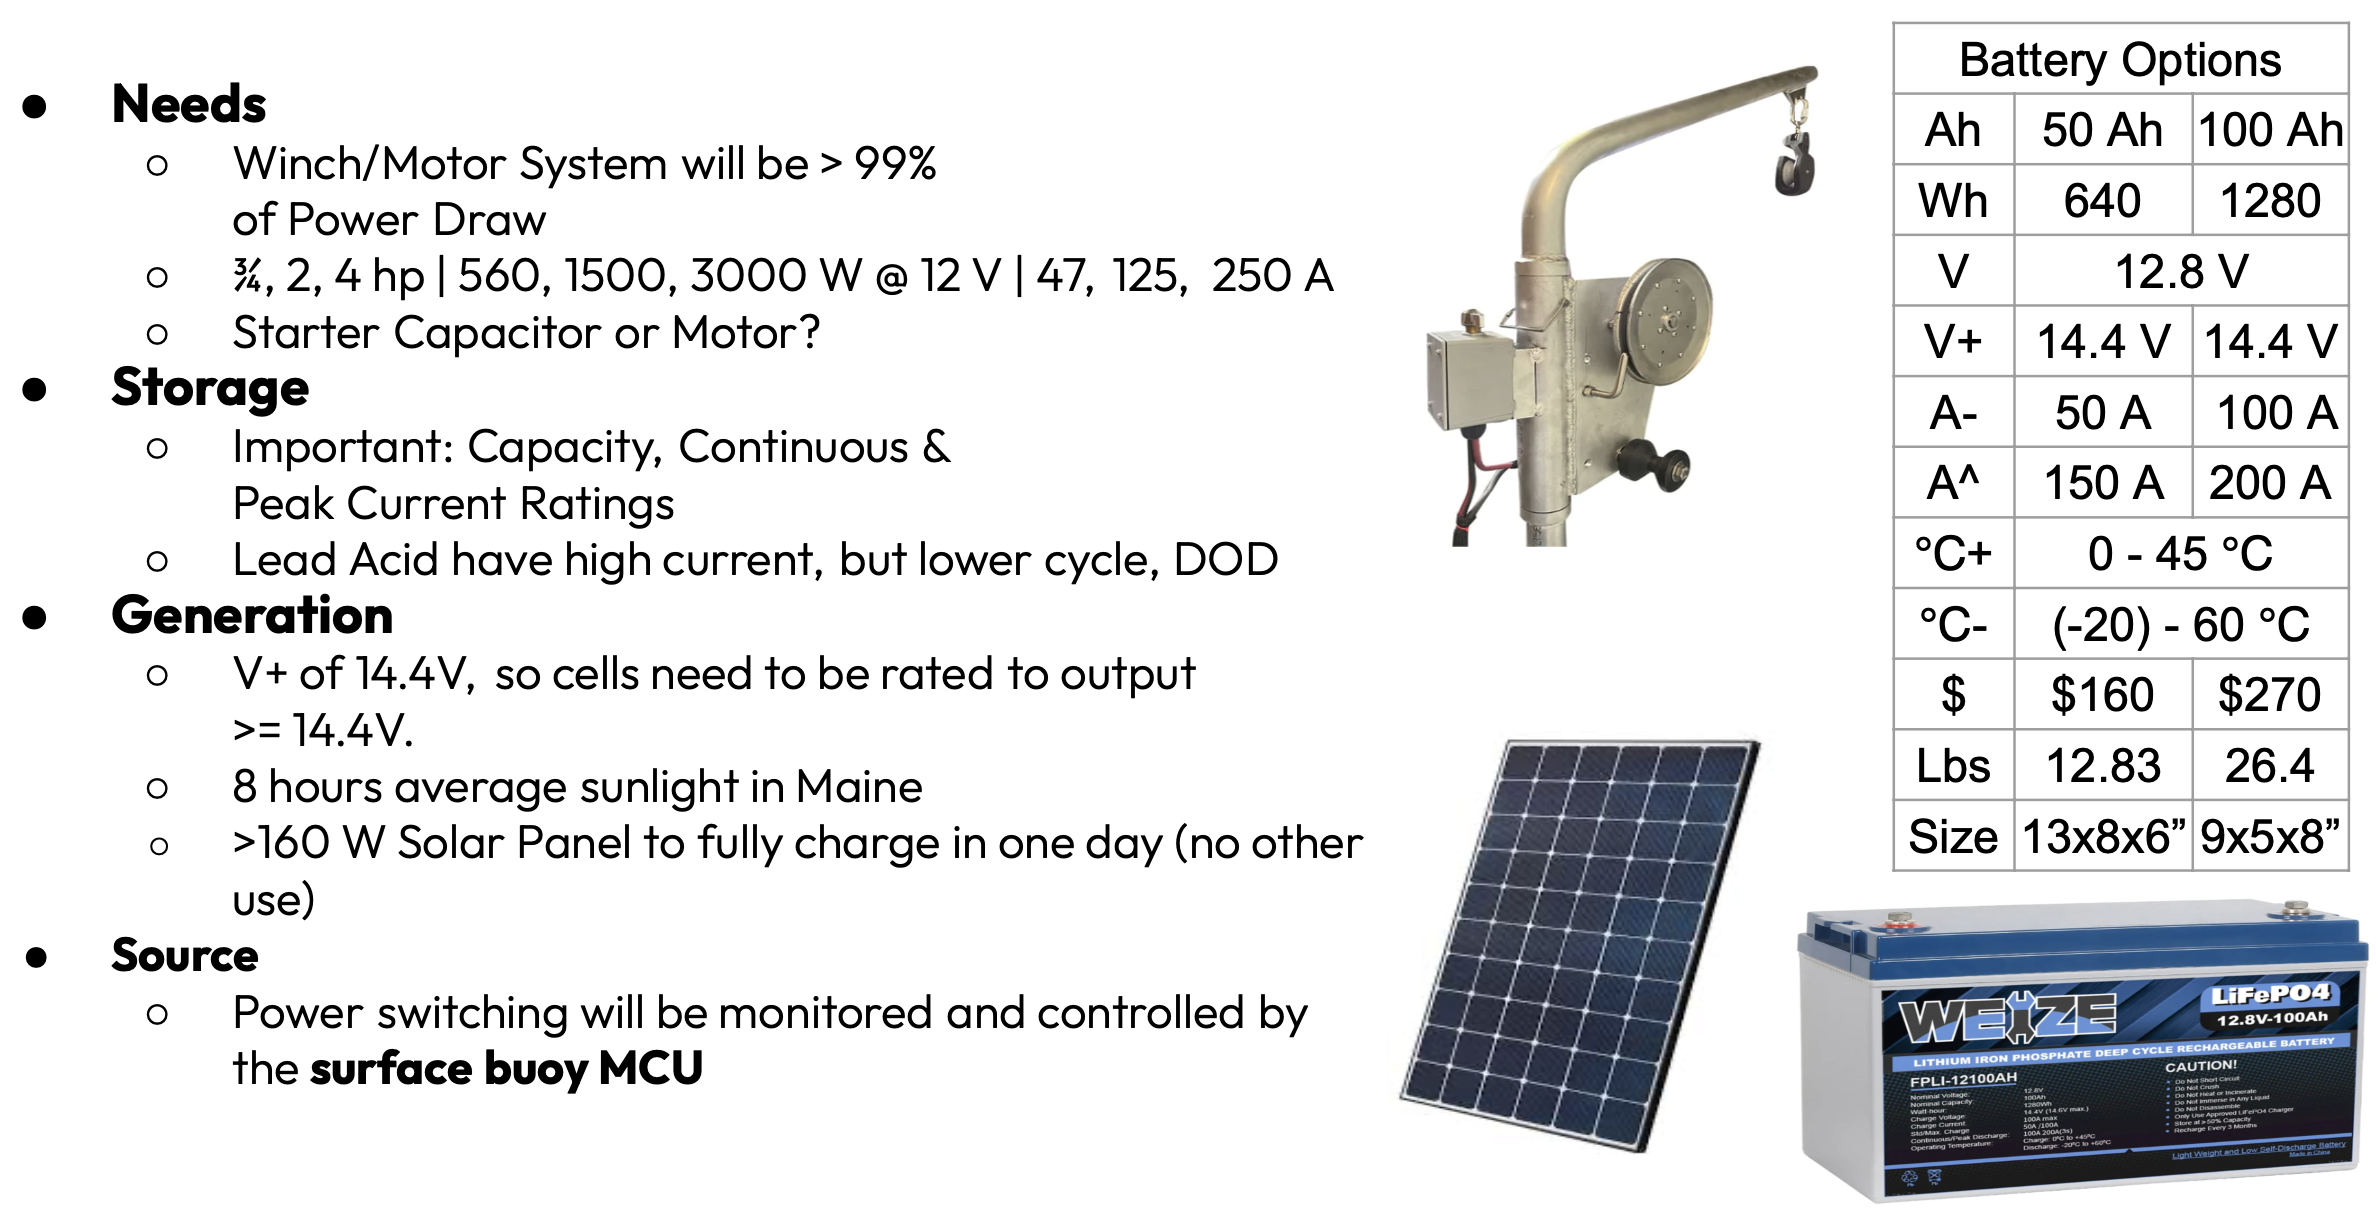
Most of the crab pot pullers I found were in the range of 3/4 to 4 hp, equating to
approximately 500 to 3000 W. At the initially planned 12V for our design, this meant a
current draw of 125 A for a 2hp equivalent system. I then made the decision to run our
system at 48V. With these considerations in mind, I opted for LifePo4 batteries due to
their high power density, lower cost compared to Li-ion, and favorable temperature,
cycle count, and discharge characteristics.
Final Power Architecture
Hard Numbers: Calculations in and Multiple Revisions Later
After receiving updated power value calculations from the mechanical team, significant
changes were made to the power design. With motor power requirements adjusted to 180W,
a 288W motor was selected for its holding torque of 8.5nM, providing a Factor of Safety
(FOS) of approximately 1.5x at 48V. The stepper motor was chosen for its 'locking'
capabilities and measurable movement based on steps. At 48V, the stepper motor would
draw a max continuous 6A, much more reasonable than the current we were looking at
originally. We also chose a Pololu motor controller that offered feedback data,
including a stall line, and the flexibility to adjust micro-stepping for future torque,
energy, and vibration optimization.
I chose a 48V, 10AH LiFePO4 battery pack with a built-in 20A BMS that would provide ample
power for peak draw requirements, supporting over an hour and a half of continuous use.
Realistically, the motor would not be running at full power continuously, and rather only
have this hour and a half of use over 2-3 days at the worst. Complementing the battery,
four 12V solar panels in series, each rated for a maximum of approximately 4 Amps, were
introduced to recharge the battery ensuring that it never discharge. This solar setup could
almost fully sustain full motor power and charge the battery from 0-80% in two hours. To
streamline the charging process and address time constraints, a dedicated charge controller
was acquired instead of designing a custom switching circuit. The controller chosen ensures
the battery is charged at the required 55V, accommodating the solar panels' peak supply of
74.4V under optimal conditions. At this point, the high voltage power architecture was
complete, and the purchases had been made.
Software Architecture
The Flowchart: States, Sensors, & Actions
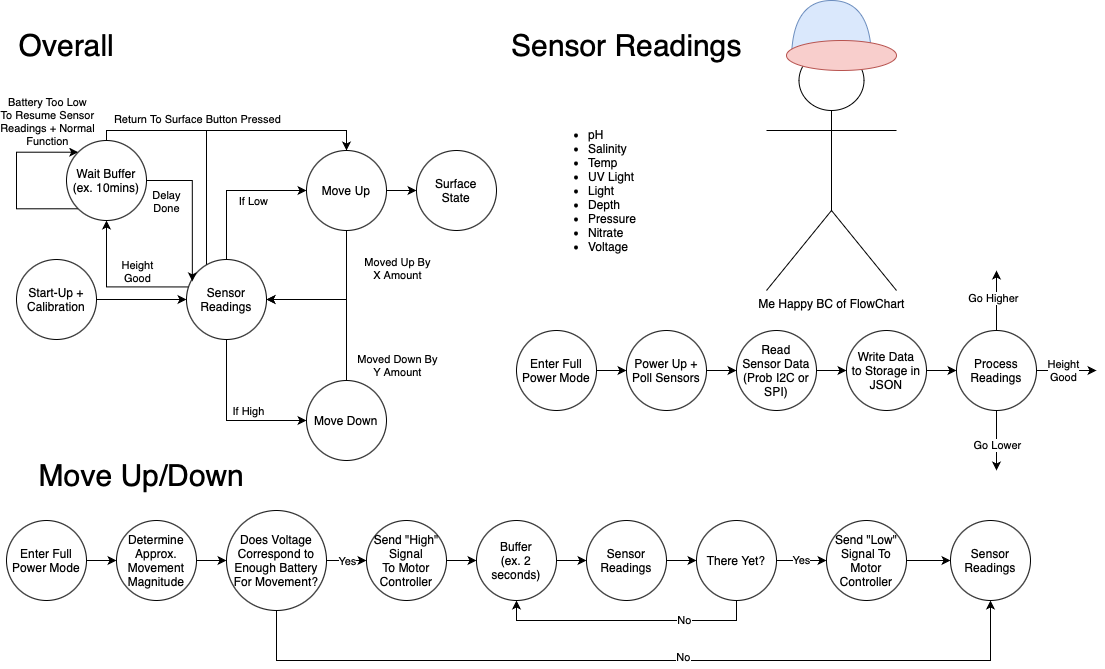
In the realm of software architecture for the WaveWise project, the focus was on
efficient and responsive handling of sensor data and movement control. I mean just
take a look at that awesome flowchart I made below! The software design was divided
into three main segments: Overall, Sensor Readings, and Movement.
Overall:
This incorporates cycles of sleep mode to conserve battery, lasting 10 minutes each,
and periodic checks of the sensors to assess the necessity of movement before
transitioning back to a low-power state.
Sensor Readings:
In this phase, the system enters a full-power mode where all sensors—measuring pH,
salinity, temperature, UV light, depth/pressure, and nitrate—are activated and polled.
The information gathered from the sensors is read through either the I2C or SPI lines.
The sensor reading process also involves the storage of data in JSON format on an SD
card for further data analysis as per the clients request. This phase was a crucial
bridge between data collection and subsequent decision-making.
Well, the client requested nitrate data, but its sensor would have single-handedly
eaten up our entire budget.
Movement:
When deemed necessary based on sensor readings, the system transitions into the
movement mode. This phase orchestrates the required movements until sensor readings
reach satisfactory levels. An important condition for movement is the
verification of a sufficiently high battery voltage ~(>15%) charge to guarantee
uninterrupted system functionality.
Key Decisions
Ups, Downs, & Inbetweens
A major decision we made was to go custom and design PCBs, ditching the tried and true
Arduino and Raspberry Pi. This was partly for the challenge, but more importantly,
it let us tailor the boards to snugly fit into our mechanical setup. Plus, we foresaw
weird connectors for certain sensors, so custom PCBs with the right connectors it
was – no messy soldering directly onto Arduino’s with a birds nest of wires (almost).
When it came to programming the boards, we ended up using the Arduino IDE. We were
able to do this by choosing the ATMega328PB as our MCU and using a FTDI chip for
programming. You'll hear about the mess of a time we had boot loading these MCUs
later on. The Arduino IDE came in handy with its quick uploads and plethora of built
in and add on libraries.
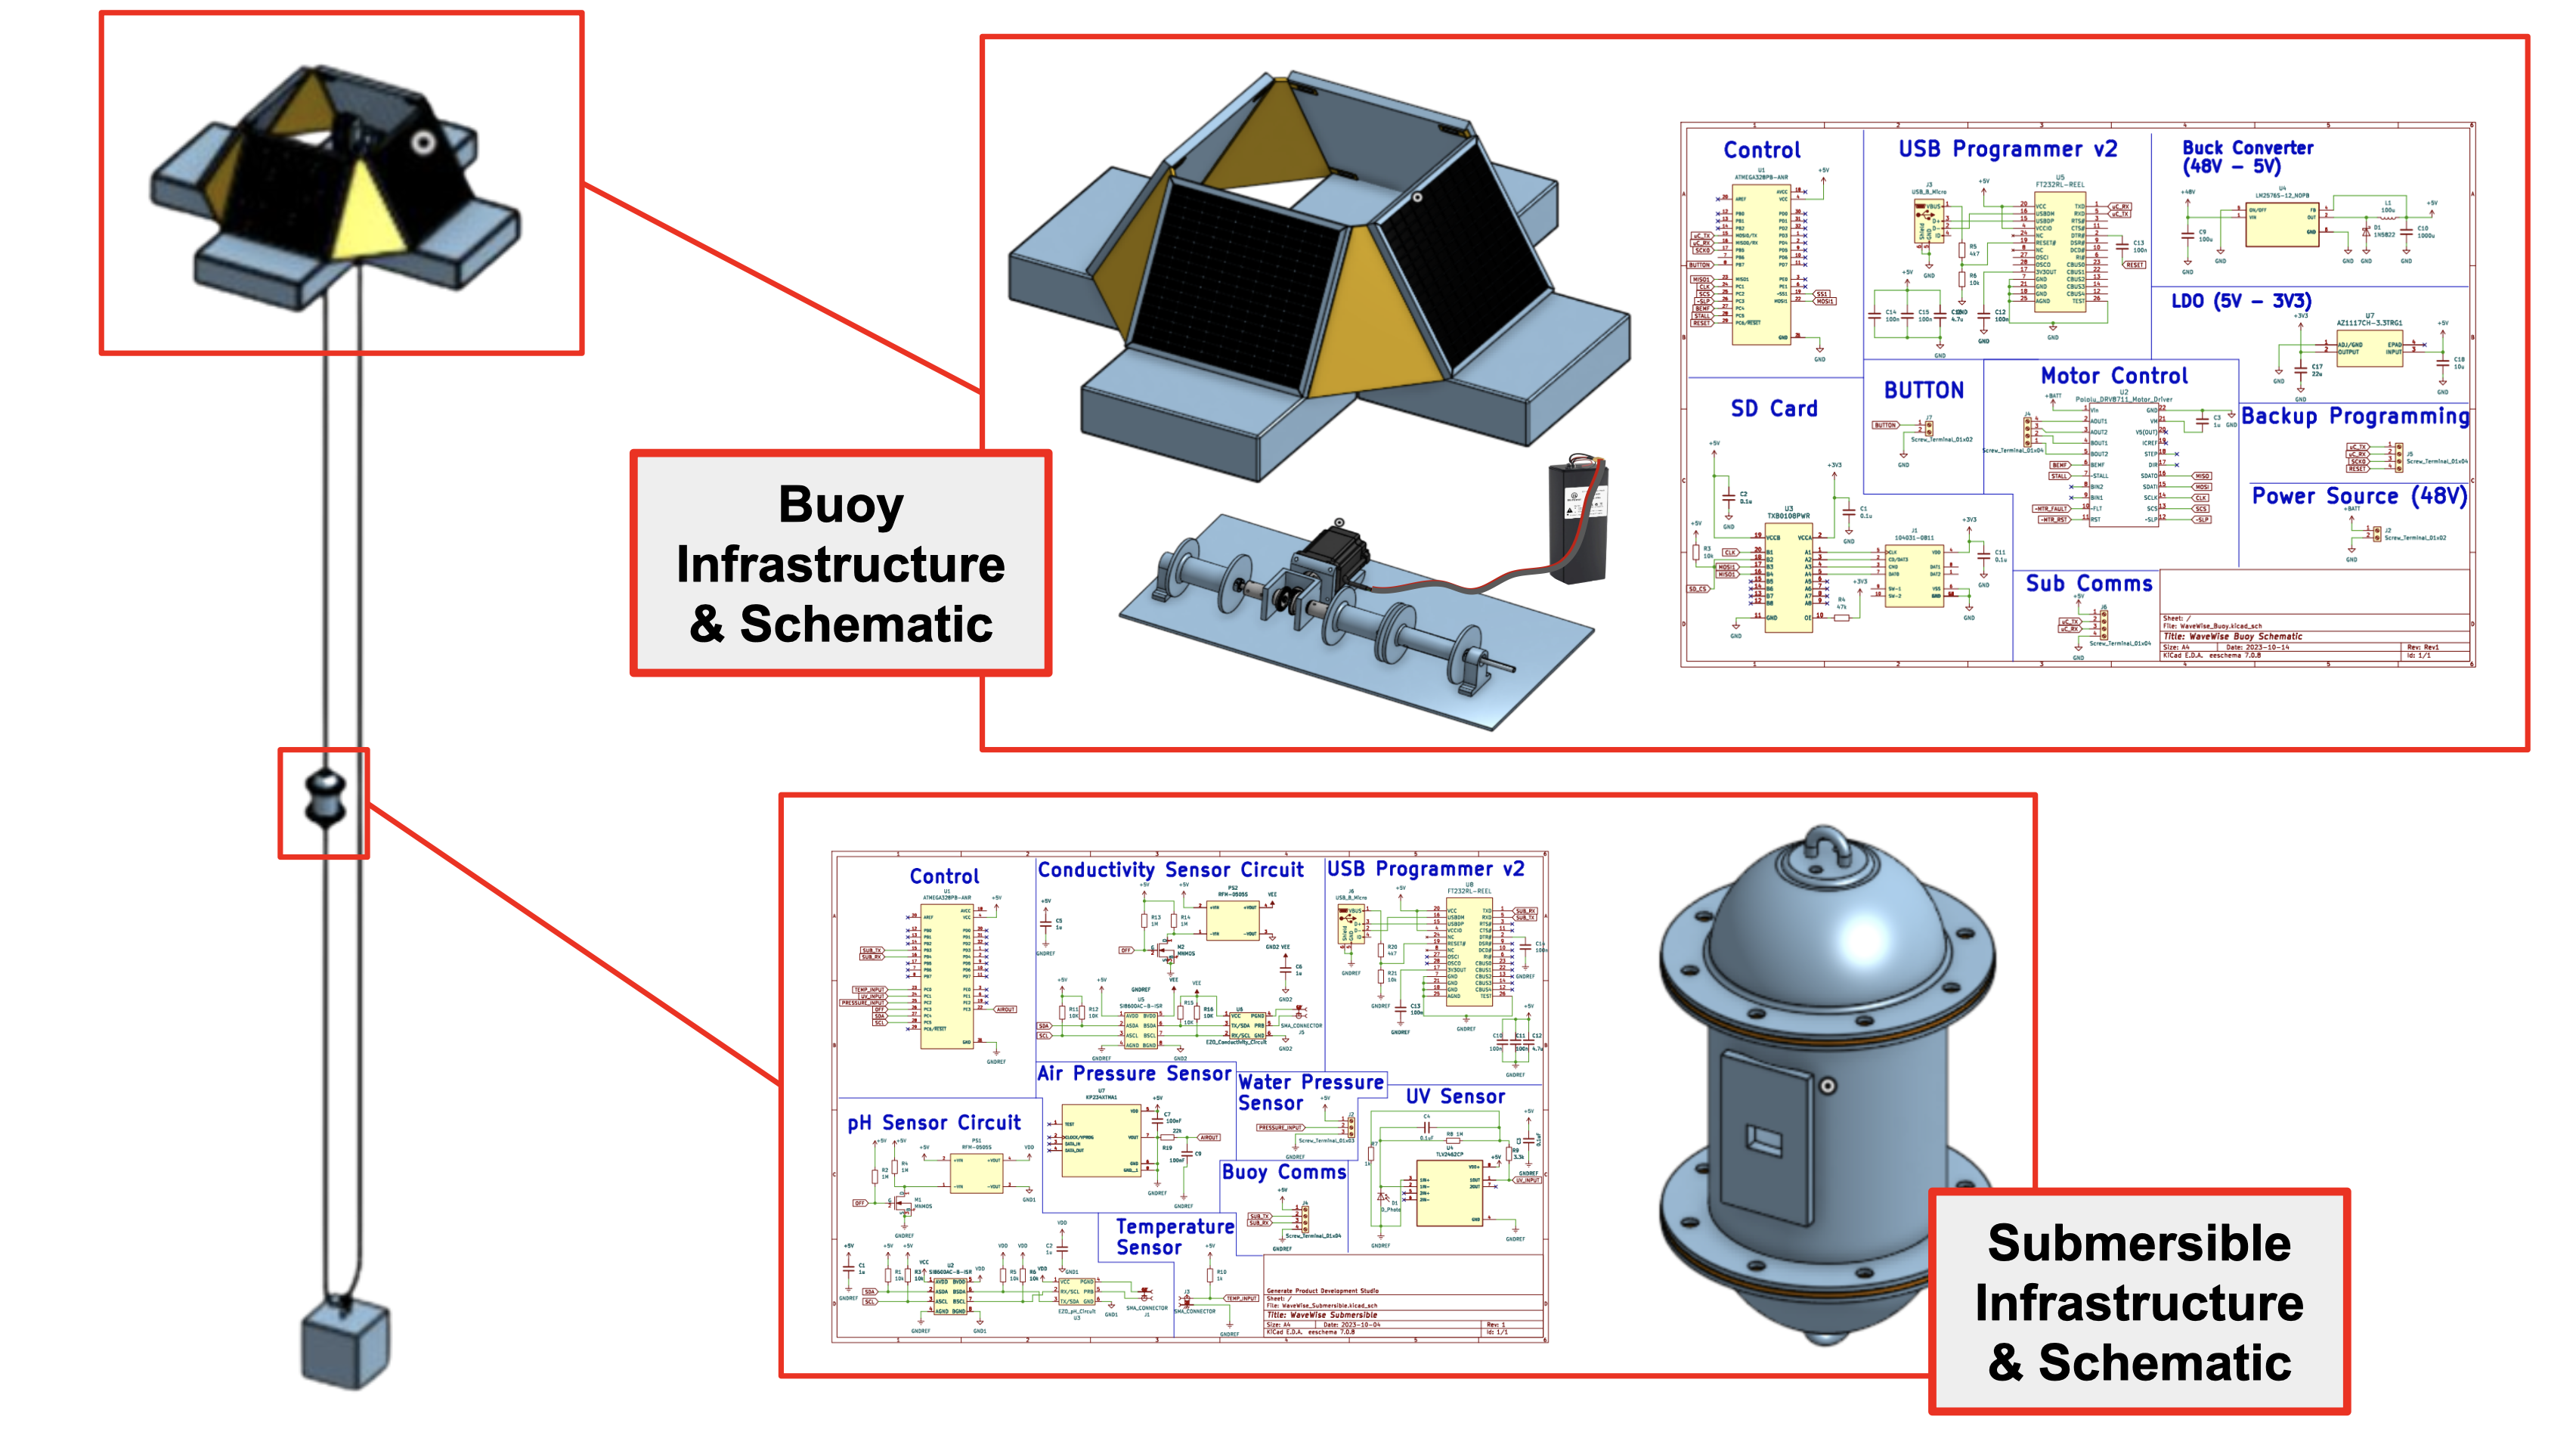
One of the biggest decisions we made was creating two PCBs. One in the floating
buoy, taking care of logic control, and the other down in the submersible, playing
host to all the sensors. They would communicate over UART, with the submersible
sending data up to the buoy for analysis and saving on an SD card. We decided to
run both ATMegas at 5V instead of 3.3V. The main reasons for this was that all
sensors could run at 5V whereas only a few would run and output data at 3.3V.
The 5V over UART would also be more stable according to our research.